
July 2, 2021
By: PIERRE SARNOW
LEAD DATA SCIENTIST
The fireworks and festivities have arrived!
Generously cushioned between Memorial Day and Labor Day, Independence Day provides another much-needed summertime holiday break for many Americans. On the trucking and transportation side, holidays fare differently depending on the fleet and industry sector.
So that you’re ensuring your fleet is prepared, I analyzed Omnitracs data to identify trends around the 4th of July and other national holidays, with special attention on the summer holidays.
Where July 4 reigns supreme
For consumers, holidays are often a time for celebratory gatherings, complete with food and alcoholic beverages. Of the holidays, the 4th of July has the most alcohol-associated stops, holding the number one slot under beer holiday rankings. This year, Americans plan to spend $1.4 billion on beer and wine. If you are a beverage distributor, you can balance extra stops and higher demand with driver routes by utilizing efficient dispatching and routing solutions.
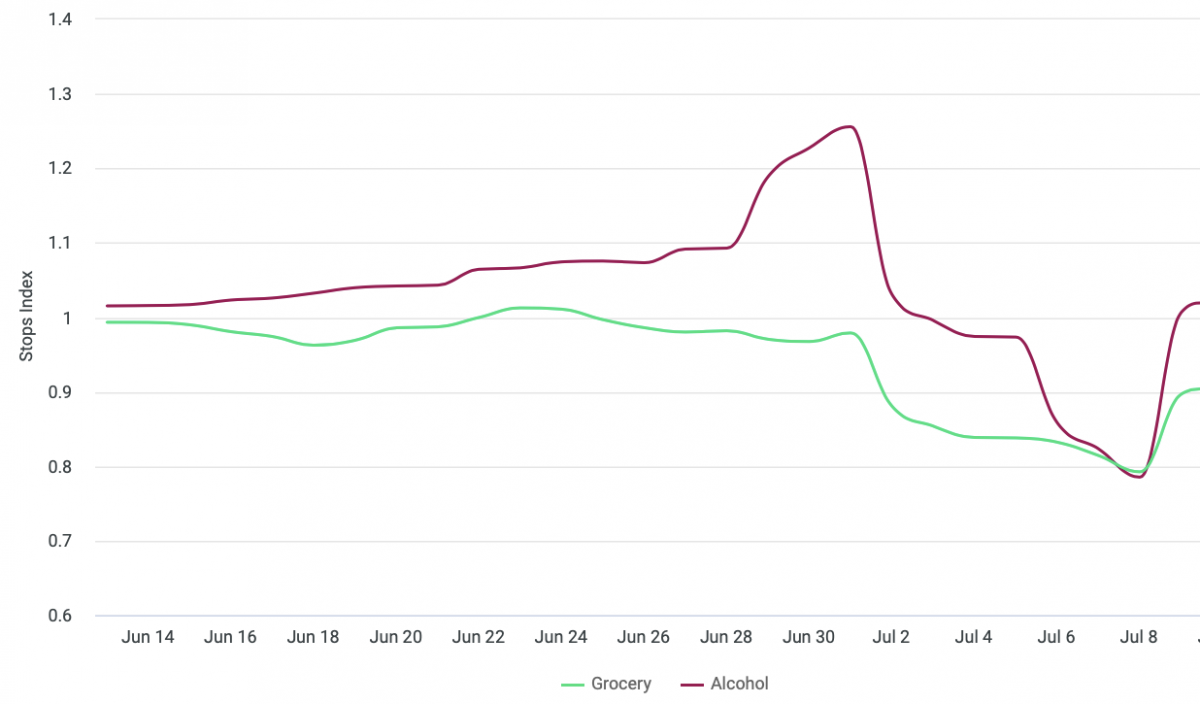
Looking below, we can see that our customers that deliver alcohol begin ramping up their activity weeks before Independence Day. It’s their most significant event of the year, and alcohol stops don’t resume their regular schedule until the following week.
Grocery stops remain steady and begin decreasing as the holiday nears. That doesn’t mean the grocery industry remains unaffected. Americans eat an average of 150 million hot dogs on the 4th of July. However, grocery is a holistic industry, and rising hot dog demand is likely balanced out by decreased demand elsewhere. As such, spikes in alcohol stops are far easier to identify.
Tame is the name of the game in the summer
Transportation activity changes around the holidays, and not all industries celebrate specific holidays the same way. Depending on the sector you cater to, you may be a fleet that’s able to take this particular holiday weekend off, or you may be scrambling to transport a thousand grills in a mad rush.
The graph below showcases the 2019 stops index. We can see that there is a major drop around July 4. That drop is also visible around Memorial Day and Labor Day. Additionally, there’s a significant drop during Thanksgiving weekend, followed by a substantial rise in December. Around New Year, these stops reach their lowest levels.
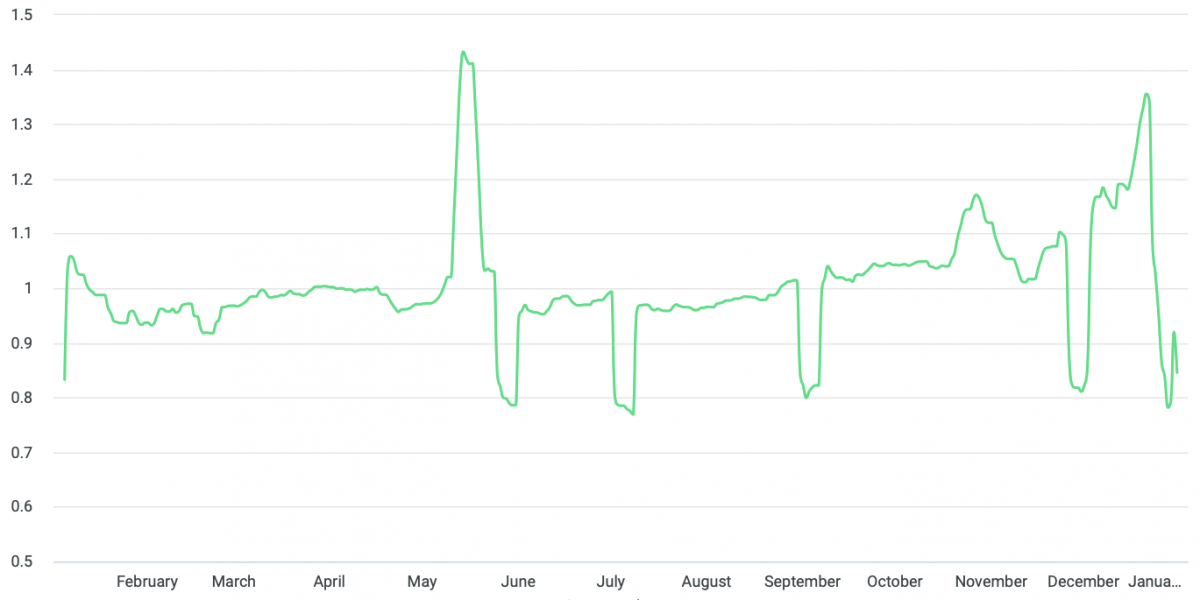
What’s interesting about this graph is how tame the peaks and valleys of the summer holidays appear in contrast to the winter holidays. Business remains steady, but there are no substantial spikes overall. You can strategically plan for summer holidays, like the 4th of July, while accounting for the tamer-than-winter business demand, if applicable.
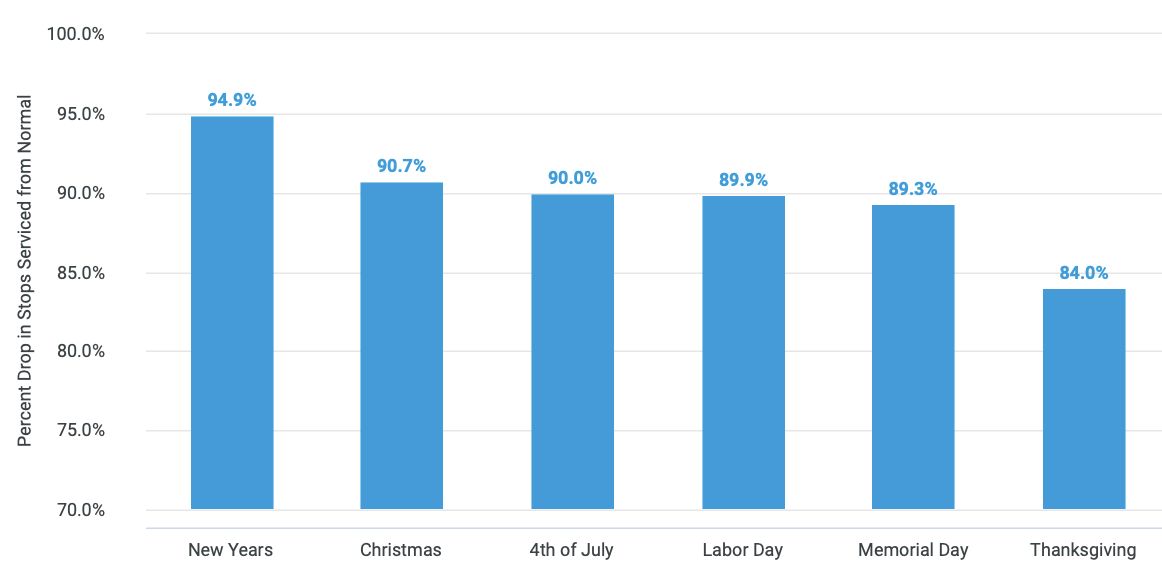
It makes sense that stops are at their lowest points on actual holiday dates, which is reflected further for good measure in the graph below. Seasonal spikes take place around the holidays and not on the days of, generally speaking.
Summer holidays offer surprising safety surges
Crash rates often increase when transportation activity is abnormal. Drivers are not driving routine routes during routine hours, although the vast majority of commercial drivers take safety seriously. Here, I ranked the collision rates by holiday.
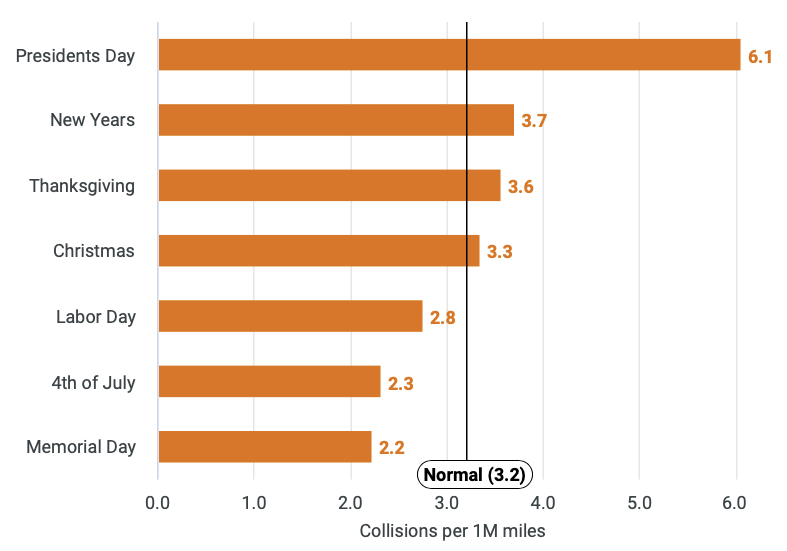
Above-average collision rates accompanied the end-of-the-year holidays and President’s Day. Interestingly, July 4 holds the second-lowest collision rate for commercial drivers. The collision rates on Memorial Day, Labor Day, and Independence Day were all under the normal benchmark. So, if you wanted to take advantage of the safer roads during these holidays, you could do so. Add a trusted video-based safety program in the mix, and you’ll reach peak smooth sailing.
I wish you and your teams a happy 4th! Keep up with more data insights on our Road Ahead Blog.